Is Bidenomics Working? A Grim Picture Emerges as Economic Indicators Falter

Economic indicators are the compass that reveals the health and vigor of a nation’s financial terrain. Amidst assurances from some political quarters of smooth sailing, these indicators weave a more complex narrative, suggesting underlying challenges and changing currents in our financial stability. Dive with us into the intricacies of our economic well-being, as we explore the headwinds it might be facing.
Inverted Yield Curve
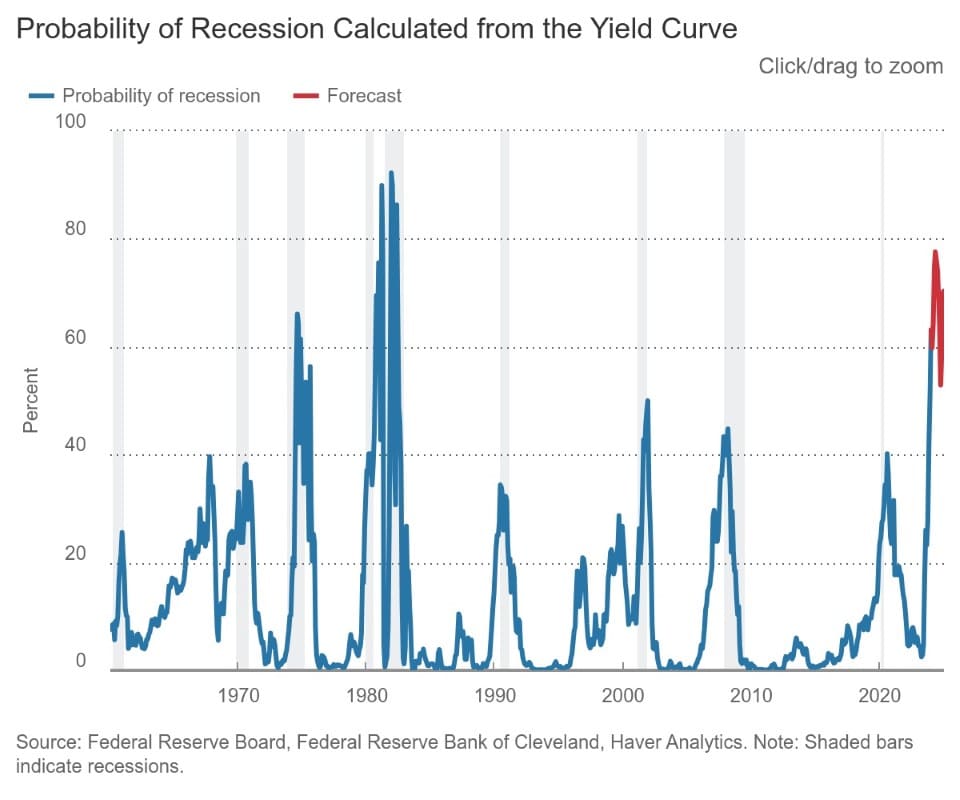
The Cleveland Fed considers the yield curve a predictor of economic growth. According to conventional wisdom, when the yield curve inverts (short-term rates surpass long-term rates), it forewarns an impending recession roughly a year later. Notably, yield curve inversions have heralded each of the last eight recessions, as defined by the NBER (National Bureau of Economic Research). A compelling case in point is the most recent recession: The yield curve inverted in May 2019, almost a year before the onset of the March 2020 downturn.
The U.S. Yield Curve (10-year minus 2-year) has been inverted since July 2022.
Surging Household Debt

According to the Federal Reserve Bank of New York, total household debt rose by $212 billion to $17.5 trillion in the fourth quarter of 2023.
The outstanding credit card balances, currently at $1.13 trillion, increased by $50 billion, marking a 4.6% rise over the prior quarter.
Auto loan balances continued their upward trend, experiencing a $12 billion increase, and currently stand at $1.61 trillion, maintaining the trajectory observed since the second quarter of 2020.
Mortgage balances increased by $112 billion from the previous quarter, reaching $12.25 trillion at the end of 2023. Americans under financial stress have resorted to using their home equity lines of credit (HELOC), which saw an increase of $11 billion, marking the seventh consecutive quarterly rise since 2022. The aggregate outstanding HELOC balances now amount to $360 billion.
Consumer Delinquencies Rising

Credit card balances, mortgage loans, and auto loans are at record-high levels as delinquency rates for most debt types continue to climb.
On an annualized basis, about 8.5% of credit card balances and 7.7% of auto loans became delinquent. Serious credit card delinquencies increased across all age groups, particularly among younger borrowers, surpassing pre-pandemic levels.
“Credit card and auto loan transitions into delinquency are still rising above pre-pandemic levels,” said Wilbert van der Klaauw, economic research advisor at the New York Fed. “This signals increased financial stress, especially among younger and lower-income households.”
Since consumer spending is a critical component of the U.S. Gross Domestic Product, an uptick in delinquency rates as individuals attempt to manage debt payments with fewer financial resources could prove disastrous.
Low Personal Savings Rate

The personal saving rate, often termed as the percentage of personal saving to disposable personal income (DPI), is derived by calculating the ratio between personal saving and DPI. Personal saving represents the portion of personal income available after deducting living expenses and taxes.
As of Dec 2023, the Personal Savings Rate stands at 3.7%, one of the lowest savings rates on record. The January and February 2024 inflation data came in higher than expected adding further pressure to household budgets.
Surging Transportation, Food and Housing Costs Crushing Americans
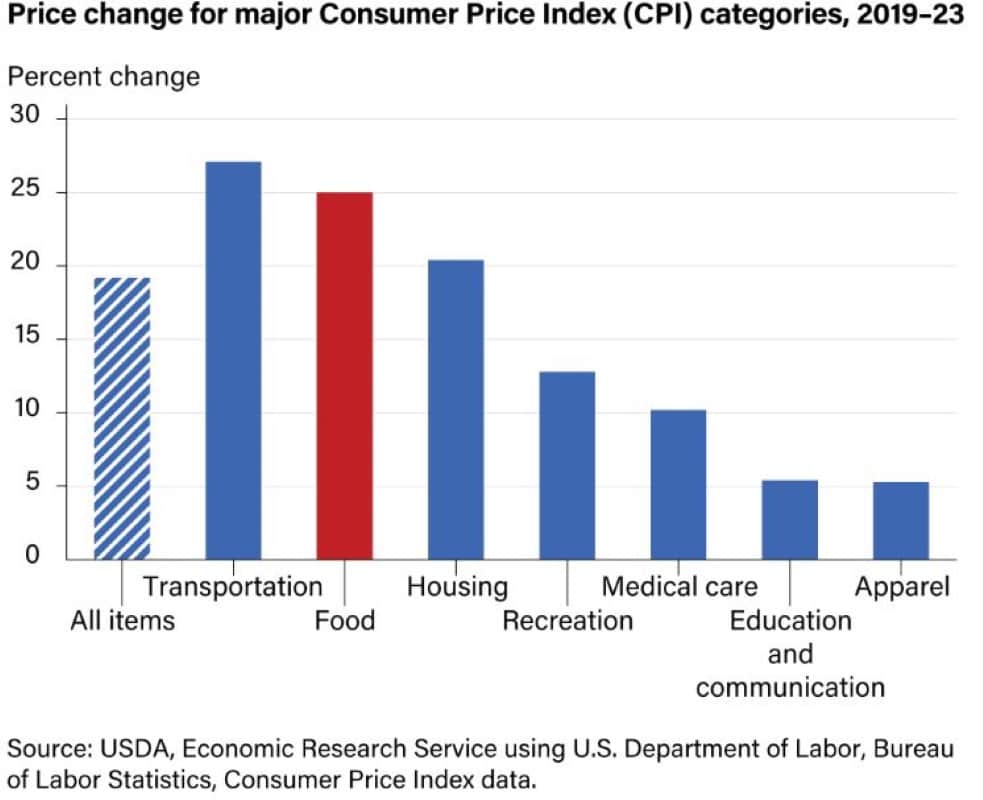
Between 2019 and 2023, the all-food Consumer Price Index (CPI) surged by 25.0 percent, surpassing the growth rate of the all-items CPI, which stood at 19.2 percent during the same period. While food prices saw a rise lower than the 27.1-percent increase in transportation costs, they outpaced the upticks in housing, medical care, and all other primary categories.
Unsustainable Federal Debt Levels
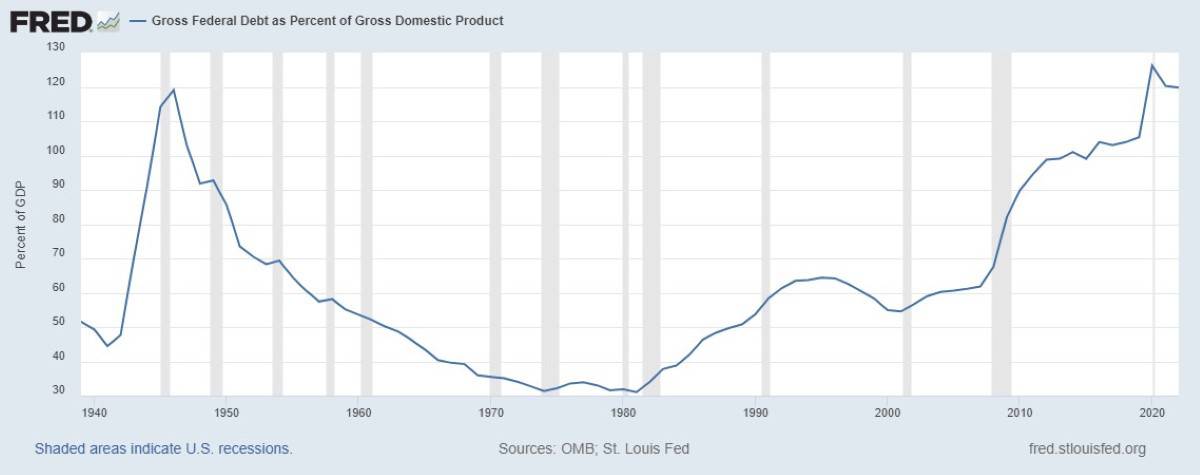
The Gross Federal Debt Levels are at an all-time high.
The Penn Wharton Budget Model projects that financial markets may struggle under the accumulated deficits forecasted under the existing U.S. fiscal policy. Financial markets anticipate that forthcoming fiscal policies will implement significant corrective measures in advance. However, if financial markets were to lose confidence in this scenario, the debt dynamics could quickly become unsustainable and potentially unravel sooner than expected.
Fed Chairman Jerome Powell has said it is past time to have an “adult conversation about fiscal responsibility.”
The debt-to-GDP ratio is currently around 121.6%, and politicians are not showing any sign of slowing spending.
Interest On Debt Unsustainable

Year-to-date, interest on Treasury debt exceeds $357 billion, showing a 37% increase from the same time previous year. It surpasses military spending and rivals only Social Security Administration or the Department of Health and Human Services. By year-end, the interest on the debt is projected to reach $1.1 trillion.
The US National Debt began the year at $34 trillion and surged to $34.47 trillion by the end of February, piling on $470 billion in merely two months. With the debt continually compounding, it’s on a trajectory to swell by $1 trillion every roughly 100 days.
At this rate of borrowing, the National Debt is projected to balloon by $2.8 trillion over the course of this year.
More Taxes Or Print Money

Higher debt must be financed with higher taxes or more money creation. Raising taxes might prove difficult, but the alternative of printing more money could result in rampant inflation. Americans have suffered in the past two years as inflation has made everyday necessities more expensive. Although the pace of price increases has slowed, food and gas prices are still higher than in the past.
Cuts to Social Programs

So far, government spending has been financed by selling U.S. debt to foreign nations. America’s ability to pay its debt is a concern for nations worldwide, which own around $7.6 trillion of our debt. Japan and China are the top two countries holding U.S. debt. Both countries have been reducing their holdings of U.S. Treasuries.
If the U.S. government can no longer find buyers for its $1.7 trillion annual debt, significant cuts must be imposed on social programs.
Is the Rosy Outlook Accurate?
The economic indicators paint a challenging narrative for the current financial landscape, questioning the upbeat declarations from certain political quarters. From the ominous signs of an inverted yield curve, historically a herald of impending recession, to the mounting household debt, surging delinquency rates, and concerning federal debt levels, the economic stage appears set for potential turbulence. As we navigate these indicators, it becomes apparent that the need for prudent fiscal measures is more crucial than ever.
The looming questions about addressing these economic challenges, whether through tax hikes or increased money creation, cast a shadow over the future. As policymakers grapple with these dilemmas, the potential repercussions, including cuts to social programs, hang in the balance, emphasizing the urgency of a thoughtful and strategic approach to navigating the uncertain economic terrain ahead.
Axios reported that House Democrats are ditching the “Bidenomics” messaging. One of the reasons cited was that voters were far more likely to say they trust former President Trump over Biden on the economy in a NYT/Siena poll in battleground states.
Like Financial Freedom Countdown content? Be sure to follow us!
Exodus From California and Massachusetts to Florida and Texas Continues

2023 saw booming demand for U-Haul equipment from California, Massachusetts, Illinois, and New Jersey as citizens chose to flee the West Coast and Northeast. On the U-Haul Growth Index, which shows net losses of one-way trucks in various states that year, California, Massachusetts and Illinois ranked 50th, 49th and 48th, respectively – marking their third consecutive year at the bottom positions. But what could be causing such a mass exodus from states like California, New York, and Illinois?
Exodus From California and Massachusetts to Florida and Texas Continues
Increasing 401(k) Hardship Withdrawals Cast a Shadow on Middle-Class Financial Stability

Recent reports from prominent financial institutions like Fidelity Investments, Bank of America, and Vanguard reveal a concerning trend: an uptick in the share of retirement plan participants resorting to hardship withdrawals from their 401(k) accounts. More individuals face immediate and significant financial strains, leading them to tap into their retirement savings as a solution. This rising trend signals a worrisome pattern, shedding light on the challenges many Americans are encountering.
Increasing 401(k) Hardship Withdrawals Cast a Shadow on Middle-Class Financial Stability

John Dealbreuin came from a third world country to the US with only $1,000 not knowing anyone; guided by an immigrant dream. In 12 years, he achieved his retirement number.
He started Financial Freedom Countdown to help everyone think differently about their financial challenges and live their best lives. John resides in the San Francisco Bay Area enjoying nature trails and weight training.
Here are his recommended tools
M1 Finance: John compared M1 Finance against Vanguard, Schwab, Fidelity, Wealthfront and Betterment to find the perfect investment platform. He uses it due to zero fees, very low minimums, automated investment with automatic rebalancing. The pre-built asset allocations and fractional shares helps one get started right away.
Personal Capital: This is a free tool John uses to track his net worth on a regular basis and as a retirement planner. It also alerts him wrt hidden fees and has a budget tracker included.
Streitwise is available for accredited and non-accredited investors. They have one of the lowest fees and high “skin in the game,” with over $5M of capital invested by founders in the deals. It is also open to foreign/non-USA investor. Minimum investment is $5,000.
Platforms like Yieldstreet provide investment options in art, legal, structured notes, venture capital, etc. They also have fixed-income portfolios spread across multiple asset classes with a single investment with low minimums of $10,000.


