U.S. National Debt Soars, Adding $1 Trillion Every 100 Days – Why It Matters
The US National Debt began the year at $34 trillion and surged to $34.47 trillion by the end of February, piling on $470 billion in merely two months. With the debt continually compounding, it’s on a trajectory to swell by $1 trillion every roughly 100 days. At this rate of borrowing, the National Debt is projected to balloon by $2.8 trillion over the course of this year. With Federal Debt spirally out of control, what lies ahead for Americans and the US economy?
U.S. Debt at All-Time High
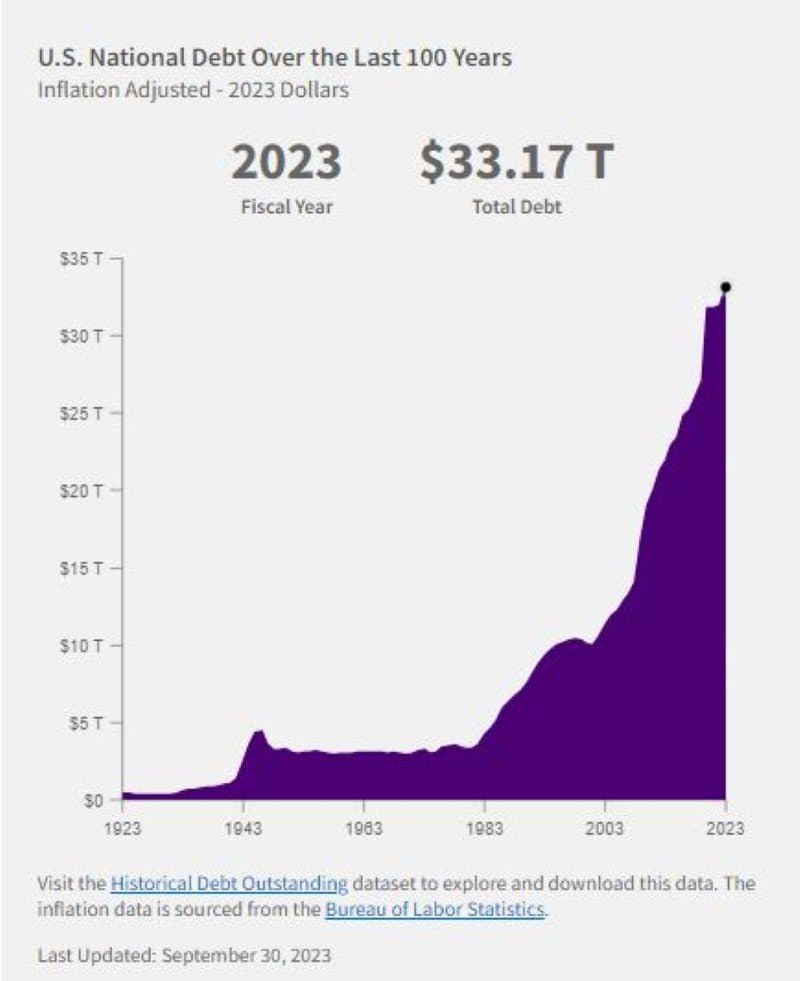
The U.S. national debt officially surpassed $34 trillion on January 4, as reported by the U.S. Department of the Treasury. Notably, it had reached $33 trillion on September 15, 2023, and $32 trillion on June 15, 2023, indicating an accelerated increase. Prior to this, the ascent from $31 trillion to $32 trillion took approximately eight months.
In the last century, the U.S. federal debt has surged ominously from $403 billion in 1923 to a staggering $33.17 trillion in 2023. Fed Chairman Jerome Powell has said it is past time to have an “adult conversation about fiscal responsibility.”
The US National Debt has now increased by $3 trillion since the debt ceiling was suspended last June (9 months ago).
National Deficit Increasing

A deficit arises when the federal government’s expenditures surpass its revenues. In fiscal year (FY) 2024, the national deficit emerged as the federal government spent $532 billion more than it collected. The deficit is expected to swell to $2.6 trillion by 2034 as per the projections of the Congressional Budget Office (CBO).
To finance government programs amidst a budget shortfall, the federal government accrues debt through the issuance of U.S. Treasury bonds, bills, and securities. This national debt represents the total of borrowed funds plus the interest due to the investors who have bought these financial instruments.
Unsustainable Federal Debt Levels As Percentage of GDP
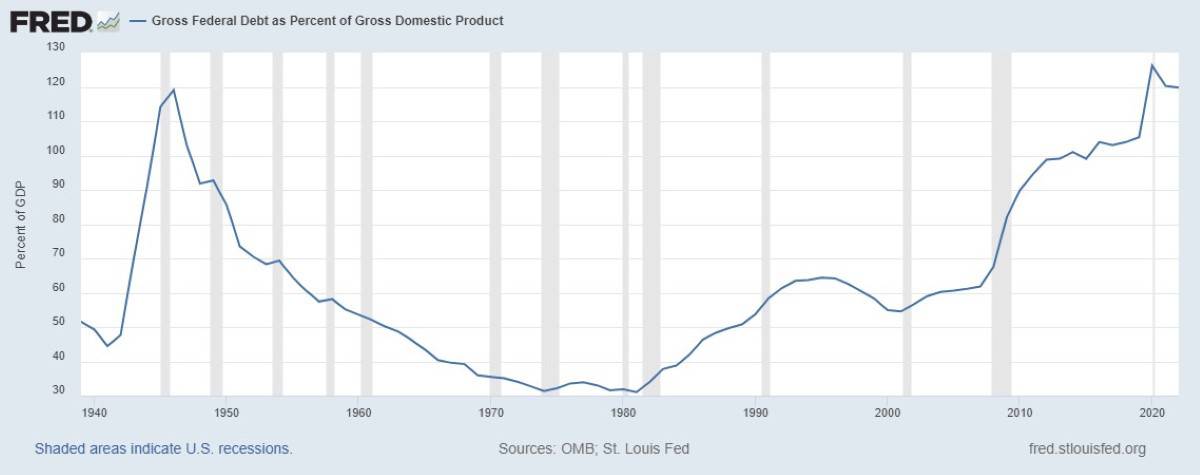
Assessing a nation’s debt in relation to its gross domestic product (GDP) provides insight into its capacity to settle the debt. This ratio is deemed a more informative gauge of a country’s fiscal health compared to the raw national debt figure, as it reflects the debt burden relative to the country’s overall economic output, indicating its repayment capability. The U.S. witnessed its debt-to-GDP ratio exceed 100% in 2013, with both debt and GDP hovering around 16.7 trillion.
The debt-to-GDP ratio is currently around 123%, and politicians are not showing any sign of slowing spending.
Interest On Debt Unsustainable

Year-to-date, interest on Treasury debt exceeds $357 billion, showing a 37% increase from the same time previous year. It surpasses military spending and rivals only Social Security Administration or the Department of Health and Human Services. By year-end, the interest on the debt is projected to reach $1.1 trillion.
The interest payments on US Federal Government Debt have surpassed a $1 trillion annual rate, increasing 98% over the past 3 years.
More Taxes Or Print Money

Higher debt must be financed with higher taxes or more money creation. Raising taxes might prove difficult, but the alternative of printing more money could result in rampant inflation. Americans have suffered in the past two years as inflation has made everyday necessities more expensive. Although the pace of price increases has slowed, food and gas prices are still higher than in the past. The January and February inflation data came in higher than anticipated confirming the pain Americans are facing everyday.
Spending By Borrowing

So far, government spending has been financed by selling U.S. debt to foreign nations. America’s ability to pay its debt is a concern for nations worldwide, which own around $7.6 trillion of our debt. Japan and China are the top two countries holding U.S. debt. Both countries have been reducing their holdings of U.S. Treasuries. The last quarter data shows that Japan has slipped into a recession.
If the U.S. government can no longer find buyers for its $1.7 trillion annual debt, significant cuts must be imposed on social programs.
The CBO Report Unveils A Dire Path Ahead

The latest report released by the Congressional Budget Office (CBO) for February 2024, offered dire projections for the country’s fiscal and economic landscape over the upcoming decade.
Critical trust funds face looming insolvency. The Highway Trust Fund is anticipated to exhaust its reserves by 2028, the Social Security retirement trust fund by 2033, and the Medicare Hospital Insurance trust fund is on track to deplete its funds by the mid-2030s.
Cuts to Social Programs

The insolvency of the trust funds would trigger automatic, across-the-board reductions in their payouts.
The CBO projects that the Social Security Old-Age and Survivors Insurance (OASI) trust fund will run out of funds by 2033, coinciding with the moment when individuals currently aged 58 reach the official retirement age and the youngest of today’s retirees hit 71. Consequently, all recipients will experience an automatic 25 percent reduction in benefits, irrespective of their age or financial situation.
Urgent Need to Tackle National Debt
The U.S. National Debt is on track for a $2.8 trillion increase this year. This unprecedented growth, reaching historic highs, poses significant challenges, including a rising national deficit, an unsustainable debt-to-GDP ratio, and unmanageable interest costs. The reliance on foreign nations for debt financing and the looming risks of a recession add urgency to address the dire projections. Critical trust funds, such as Social Security and Medicare, are facing insolvency, emphasizing the need for immediate and comprehensive fiscal strategies to navigate the complex economic landscape ahead.

John Dealbreuin came from a third world country to the US with only $1,000 not knowing anyone; guided by an immigrant dream. In 12 years, he achieved his retirement number.
He started Financial Freedom Countdown to help everyone think differently about their financial challenges and live their best lives. John resides in the San Francisco Bay Area enjoying nature trails and weight training.
Here are his recommended tools
M1 Finance: John compared M1 Finance against Vanguard, Schwab, Fidelity, Wealthfront and Betterment to find the perfect investment platform. He uses it due to zero fees, very low minimums, automated investment with automatic rebalancing. The pre-built asset allocations and fractional shares helps one get started right away.
Personal Capital: This is a free tool John uses to track his net worth on a regular basis and as a retirement planner. It also alerts him wrt hidden fees and has a budget tracker included.
Streitwise is available for accredited and non-accredited investors. They have one of the lowest fees and high “skin in the game,” with over $5M of capital invested by founders in the deals. It is also open to foreign/non-USA investor. Minimum investment is $5,000.
Platforms like Yieldstreet provide investment options in art, legal, structured notes, venture capital, etc. They also have fixed-income portfolios spread across multiple asset classes with a single investment with low minimums of $10,000.


